
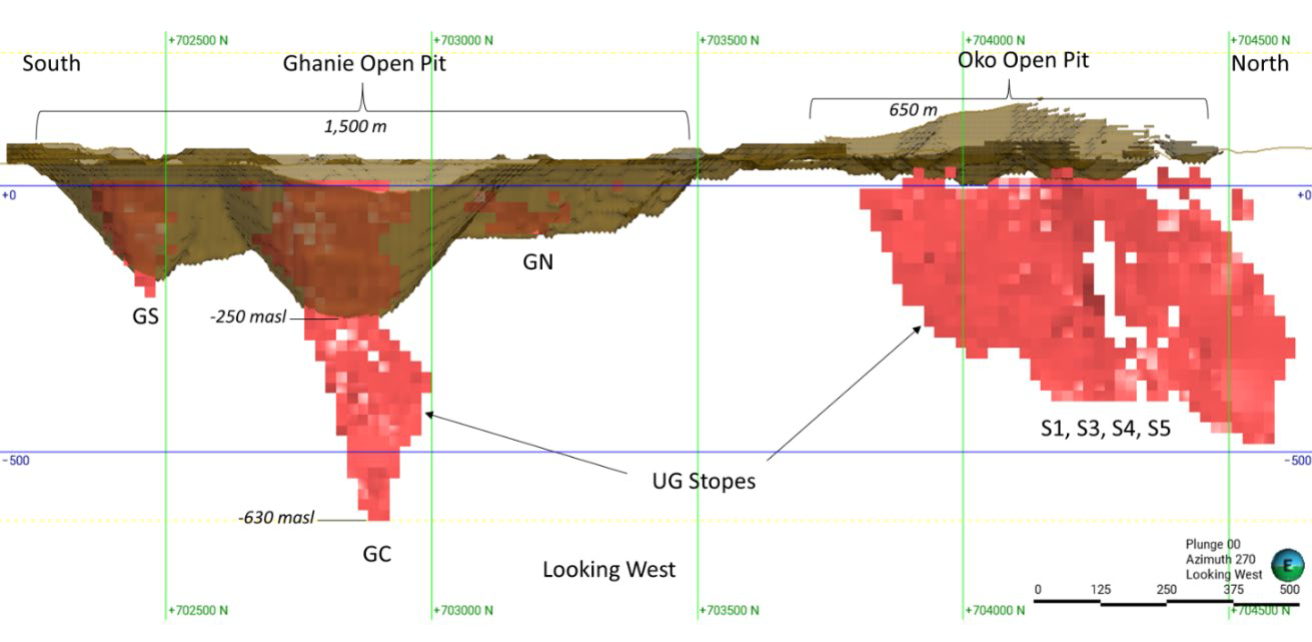
Oko is located in Guyana, 120 km southwest of the capital, Georgetown. Oko is an orogenic gold deposit made up of two primary structures, Oko Main Zone (OMZ) and Ghanie Zone (GZ), with gold bearing veins hosted in mineralized shear zones that are part of the Aremu-Oko gold district located in the Cuyuni Greenstone Belt. Local artisanal miners knew of gold in the area and extracted free gold along the Aremu River, panning and alluvial mining in the late 19th Century. The United Nations commissioned surveys of the area in the 1960s and in the 1990s, a number of companies carried out exploration campaigns. Exploration resumed in the 2010s, first with Guyana Precious Metals, and later with G2 Goldfields optioning claims since 2017. Artisanal mining has been ongoing since 2011, with a number of shafts and alluvial operations on the property. No record exists regarding the quantity of gold extracted by these small scale miners.
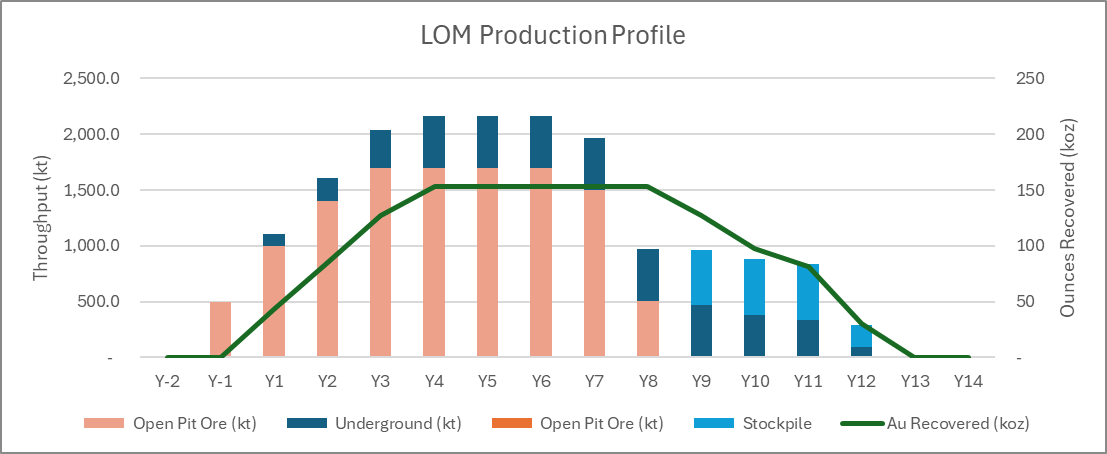
The Technical Report envisaged a 2 Moz Resource totalling 20 Mt, of which 75% of the tonnes and 40% of the ounces originated from open pit and the remainder from underground. Underground Resources were constrained with longhole panels, although the report contains inconsistencies regarding minimum width, with some instances mentioning 2.0 m and others mentioning 1.5 m. Since no Reserve was declared, the Technical Report does include a mine plan. Mining Momentum estimated a Life of Mine plan by applying conversion factors of 75% to the M+I Resource and 50% to the Inferred Resource, resulting in 1.2 Moz from 11.6 Mt. Using this as the lower bound, Mining Momentum used the average of 1.6 Moz from 16 Mt as the basis of the mineable Resource for the LOM. Evaluating productivity given the size of the deposit, Mining Momentum estimated steady state throughputs of 1.7 Mtpa for open pit and 0.5 Mtpa for underground. Production is estimated to have 12 years of production, with peak processing capacity just under 1.9 Mtpa. Using the recovery of 85% described in the Technical Report, Mining Momentum estimated an annual production of 150 koz at steady state.
| Tonnes (Mt) | Grade (g/t) | Contained (koz) | |
|---|---|---|---|
| M+I | 5.7 | 5.03 | 922 |
| OP | 3.8 | 2.18 | 264 |
| UG | 1.9 | 10.51 | 658 |
| Inferred | 14.6 | 2.34 | 1,099 |
| OP | 11.2 | 1.36 | 490 |
| UG | 3.4 | 5.55 | 608 |
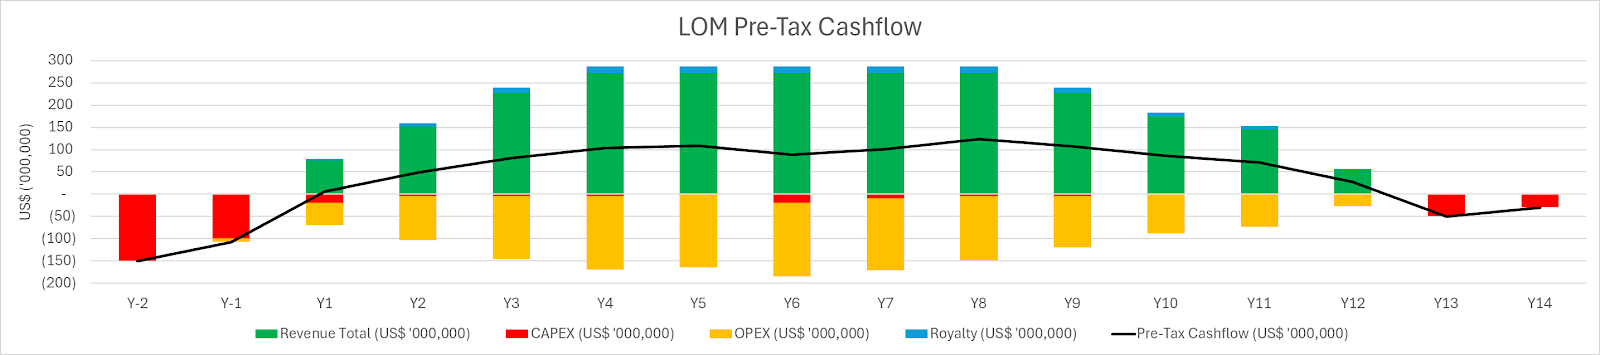
We then constructed a financial model based on the parameters prescribed in the Technical Report. At first glance, the costs used to define the Mineral Resources in the Technical Report appear appropriate. However, accounting for the size of the deposit, Mining Momentum is of the opinion that unit costs are too low. In our financial model, we have doubled the operating cost, allocated US$250 M preproduction capital, US$75 M sustaining capital, and US$80 M in closure costs. The results are summarized below:
| Units | US$1,900/oz | US$2,500/oz | |
|---|---|---|---|
| Pre-Tax Cashflow | US$ ‘000,000 | 618 | 1,382 |
| Pre-Tax NPV10% | US$ ‘000,000 | 184 | 542 |
| Pre-Tax IRR | % | 21 | 37 |
Mining Momentum does not offer financial advice, but we are aware of the popularity of the G2 Goldfields stock. There has been a whirlwind of exploration activity at Oko and the excitement is palpable. But as the old saying goes, “when others are greedy, exercise caution”, Mining Momentum urges readers to do their own due diligence and remain rational. Temper your expectations, Oko will need a lot more than 1.6 Moz to become a large mine. With that in mind, we have found the project fairly robust. After applying discounts and adjustment factors, Oko remains viable. Annual gold production of 150 koz is respectable, albeit not Tier 1. What Oko offers is the hope of a larger discovery and what has been found so far supports further work on this project. Worst case scenario, it can still operate as a small mine.
The information presented above does not constitute investment advice. This is a summary from the NI 43-101 Technical Report effective March 27, 2024 (INSERT), with commentary from the author. Statements above do not represent the views of G2 Goldfields. If any discrepancies arise, the information contained within the NI 43-101 are official and final. For latest depletion data, please refer to the AIF update.